
Cadmium telluride
Cadmium telluride (CdTe) and cadmium zinc telluride (CdZnTe, or CZT) are semiconductors with applications in solar cells and particle detection. For the solar cell market, low-cost synthesis techniques must be developed. In semiconductor alloys determination of the concentration of alloy constituents is of considerable importance to understand process dynamics during synthesis. In this example we will use cadmium zinc telluride (CZT) to show how the Zn content of CZT can be mapped using photoluminescence (PL) spectra.
CZT is often grown using the Bridgeman technique in large boules. CZT typically has a weak PL signal and normally displays only a single well-defined peak. Klar’s microscopes are very sensitive, and using our robust modeling of the spectral features, small changes in PL peak energy can be detected.
For this example, a slice of a CZT boule was mapped using a Klar Mini Pro instrument with 532 nm excitation, and the resulting PL spectra were fitted using a single bigaussian function. Figure 1 shows an example spectrum and fit and Figure 2 shows a spatial map of the peak energy. In these fits, available parameters are the emission peak energy, peak amplitude and peak width. We are presently concerned with the peak energy only.

Fig. 1. Example PL spectrum (black) and fit (red) from a CZT boule. Here a single bigaussian curve is used to model the PL spectrum. Available parameters are peak energy, peak amplitude and peak width.

Fig. 2. False color map of the PL peak energy. Each point shows the value of the peak energy obtained from the spectral fits as shown in Fig. 1
Due to the fact that the band gap changes with composition in a known way, we can use the fitted peak energy to infer the Zn content of the sample and thereby generate a spatial map of the Zn concentration. Note: because these measurements were taken at room temperature, we ignore effects such as exciton binding energies and take the PL energy to be the band gap energy. The box below shows how to relate the band gap energy to the Zn concentration.
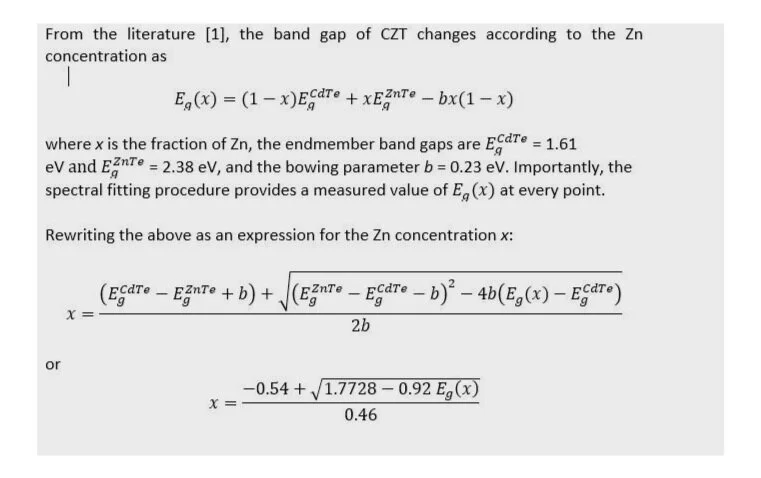
Using the fitted band gap energy in the equation for x, we can set up the Klar software to easily plot the Zn concentration in a slice from the boule, as shown in Fig. 3.

Fig 3. Map of the Zn concentration in the CZT boule calculated using the fitted peak energies from Figure 2 and the expression listed above. The map shows the striations in the Zn content due to inhomogeneous mixing during crystal growth.

Fig 4. False-color image of the PL peak energy in a slice from a CdZnTe boule with a slowly varying Zn concentration.
Note: in the absence of a known bowing parameter, a user can utilize Klar’s instruments in conjunction with EDS mapping or similar analytical techniques to determine the relationship between measured band gap and measured concentration.
Comparing multiple maps provides information about process dynamics and their influence. Fig. 3 shows inhomogeneous striation patterns in the Zn concentration during growth from poor mixing of the melt, while Fig. 4 shows a gradient in the variation of the composition along the growth axis due to Zn depletion as the crystal is pulled out of the melt.
In summary, the procedure followed was 1) collect spectra, 2) fit spectra to find peak energy, 3) use known relationship between band gap and concentration to find concentration, and 4) compare samples to understand process dynamics.
[1] V. Corregidor and E. Dieguez, Correlation of resistivity with zinc content in a vapor grown (Cd,Zn)Te:Se, Appl. Phys. Lett. 81, 5153 (2002); https://doi.org/10.1063/1.1533124