Photoluminescence and Raman from the UV to near IR
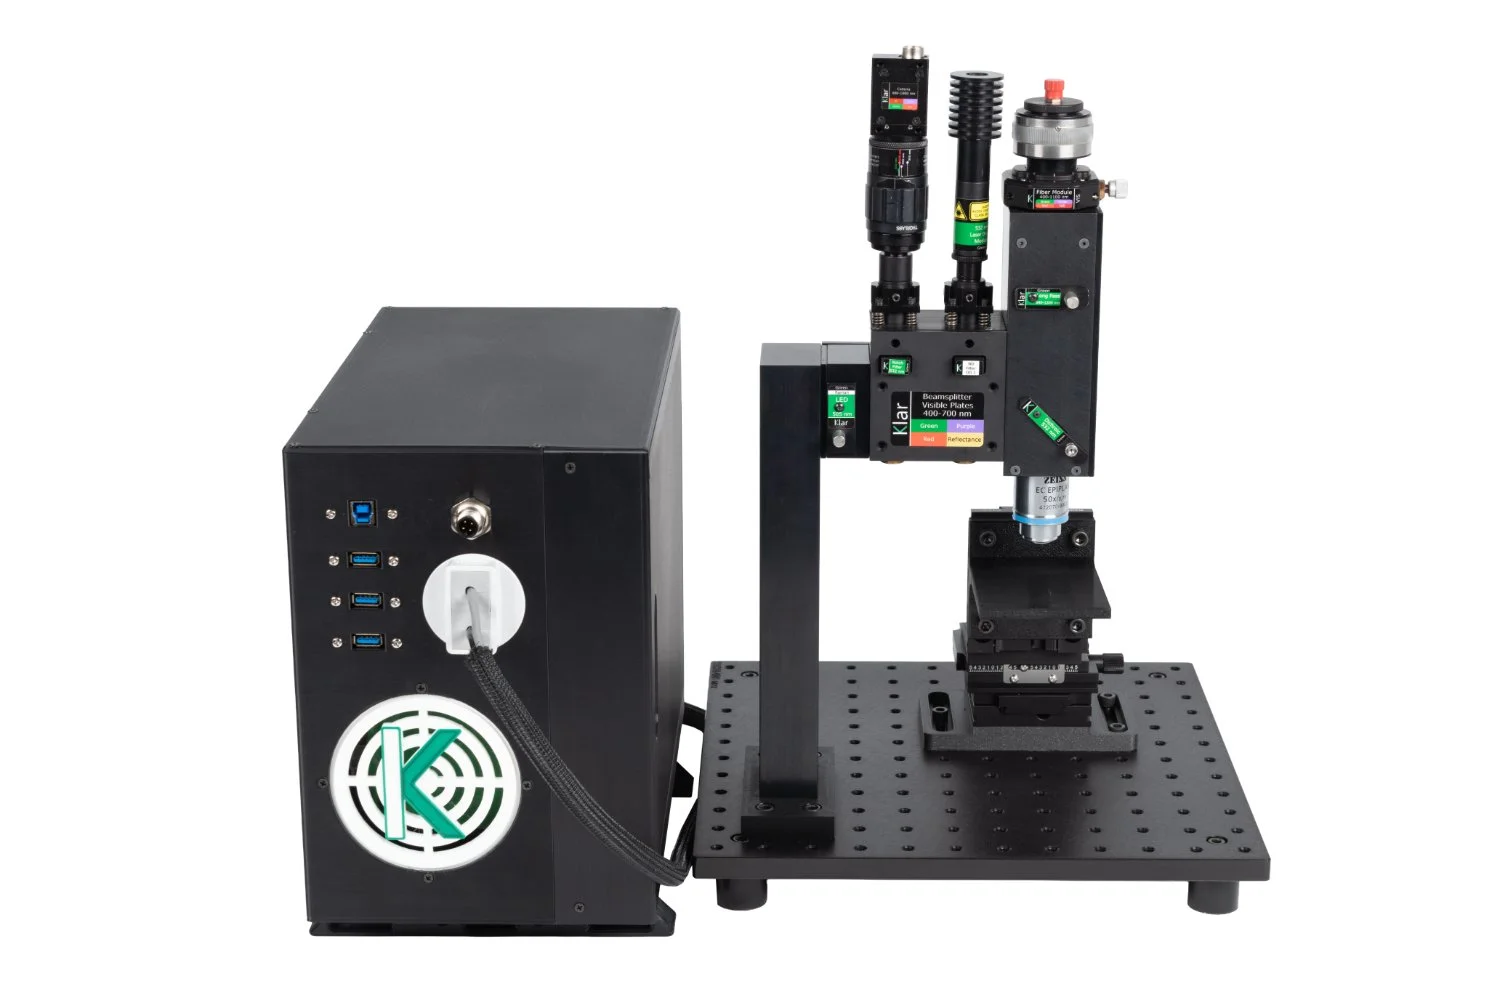
Spectroscopic Mapping Microscopes
Obtain PL and Raman Maps using Klar Microscopes
Klar Microscopes have a universal optical design that allows the owner to expand capabilities with user-replaceable wavelength kits from deep UV to the near IR.
-
Ideal for individual labs
Low entry price point
Light excitation 349 to 975 nm
Configurable spectral range 349 to 2500 nm
Diffraction limited spot size
Compact footprint (1 sq. ft.)
Ready to go instrument*
Highly adaptable to your experimental needs
Use with virtually any sample
Add optical spectroscopy to your lab and experimental process
Customize using standard optical components
Raman option available
*with purchase of spectrometer and kit

-
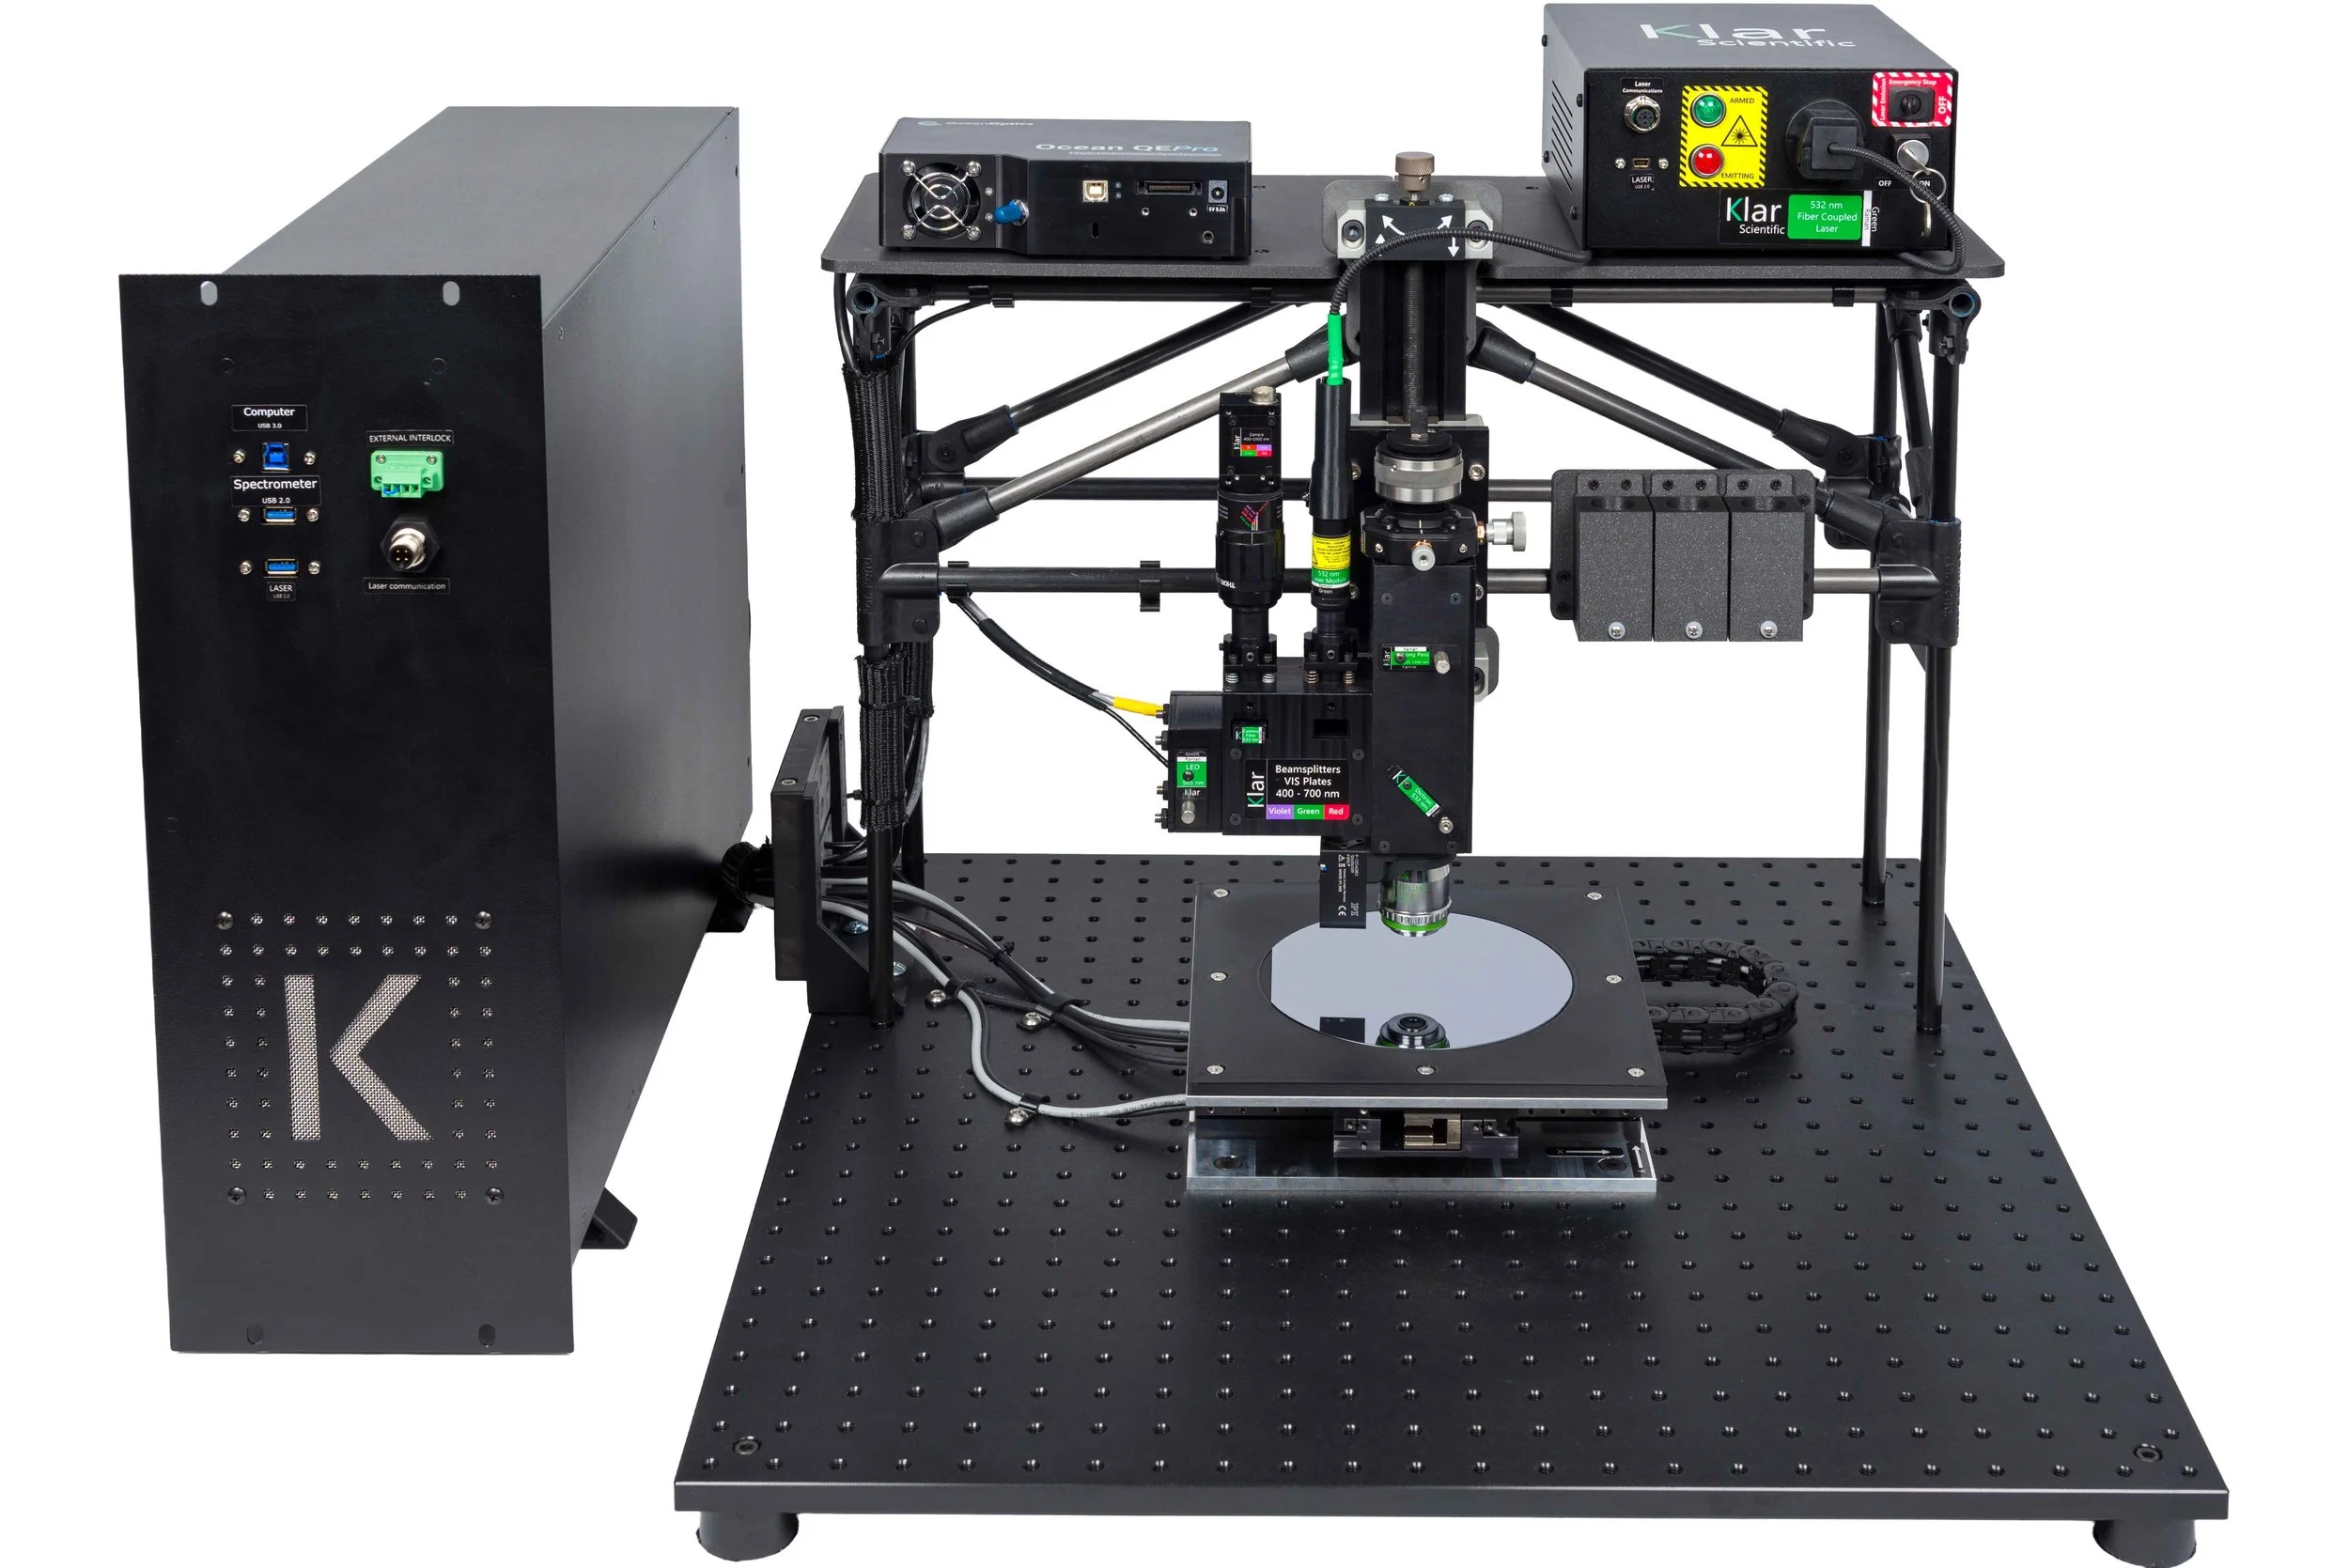
This system is ideal for shared measurement labs
Designed for scientists who need spectral information with high spatial resolution
Light excitation 266 to 975 nm
PL spectral range 266 to 2500 nm
Submicron in-plane resolution
Millions of spectra can be collected
GPU accelerated fitting and analysis software
Compact footprint (1 sq. ft.)
Enclosure insulates microscope from temperature variations, dust, and light
Integrated laser safety system
Low temperature option
Raman options available
Everything you need to start taking data
-
Ideal for wafer level studies
Scanning capacity of 150 mm x 150 mm
Supports probes and other add-ons.
Ideal for wafer level studies
Light excitation 349 to 975 nm
COMING SOON! Light excitation 266nm
PL spectral range 266 to 2500 nm
Submicron in-plane resolution
Millions of spectra can be collected
GPU accelerated fitting and analysis software
Compact compared to equivalent products
External interlock connector
Integrated laser safety system
Low temperature option
Everything you need to start taking data
Most flexible and versatile microscope
Fits a huge variety of samples
Accommodates many extras
Raman options available
Native Python libraries to facilitate data fusion
PL and Raman mapping fuse well with other spatial techniques such as EDS and SEM
Matt McCluskey, Klar's co-founder and Chief Technology Officer, named a 2025 American Physical Society (APS) Fellow
〰️
Matt McCluskey, Klar's co-founder and Chief Technology Officer, named a 2025 American Physical Society (APS) Fellow 〰️
Universal Optical Design
Allows the user to expand capabilities with user-replaceable wavelength kits.
High Speed Technology
The only technology capable of optical emission, modulation, and detection at very high speeds.
Native Python Libraries to Facilitate Data Fusion
PL and Raman mapping fuse well with other spatial techniques such as EDS and SEM.
Spectroscopy
Spectroscopy from the near-IR to the deep-UV (975 – 266 nm)
PL and Raman Mapping with the Same Instrument
Resolution where you need it. Set the resolution to whatever you desire.
Ambient and Low Temperature
The low-temperature kit provides spectroscopic microscopy down to 80 K.
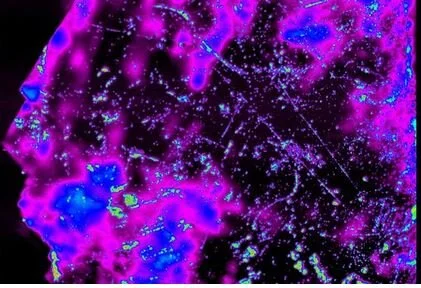
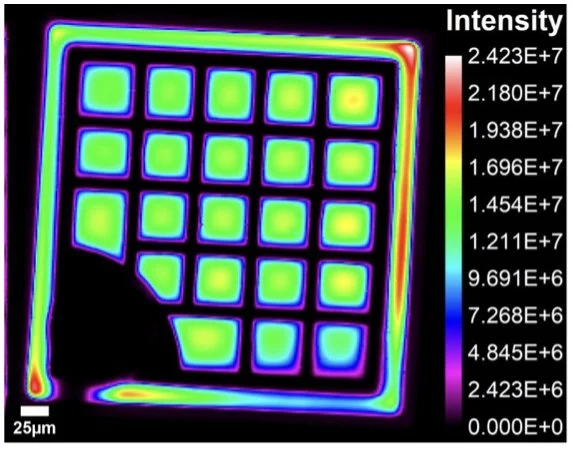
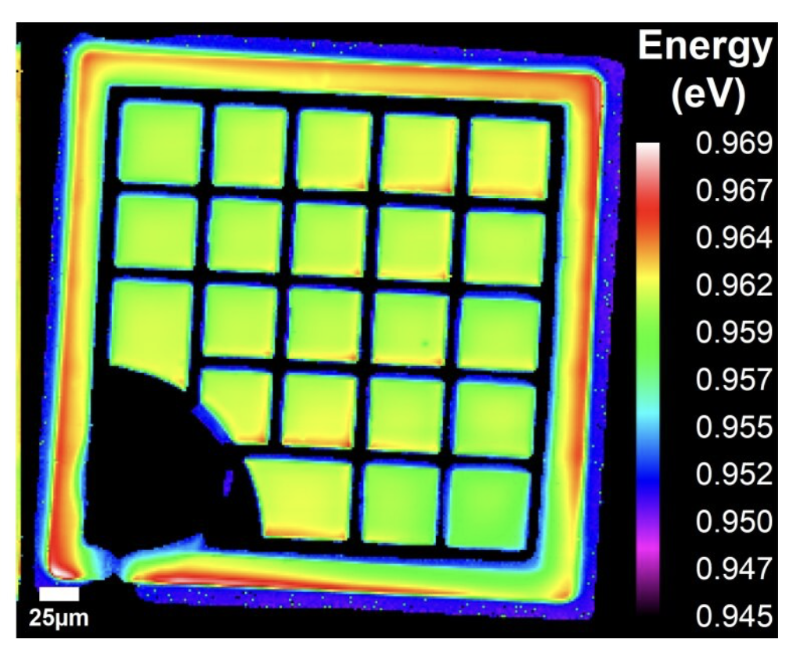
Discover Defects, Dislocations, Inhomogeneities, Damage, and Much More in your Materials and Devices
-
![A colorful, abstract digital art piece with neon pink, purple, blue, and green hues, featuring a cosmic or space-like pattern with dots and lines.]()
Gallium Oxide Defects
-
![A color-coded scientific image showing energy levels in electron volts, with a scale from 1.340 to 1.350 eV, featuring numerous small dots and features on a blue background.]()
Dislocations in InP Wafers
-
![Microscopic view of mineral crystals with labeled elements: red for calcite, green for willemite, blue for zincite, and a small inset showing a crushed mineral sample.]()
Geology and Gemology
-
![Comparison of a green leaf with a colorful topographical map of a leaf's surface, showing the intensity ratio with a color scale]()
Dynamical Processes in Agriculture


Services
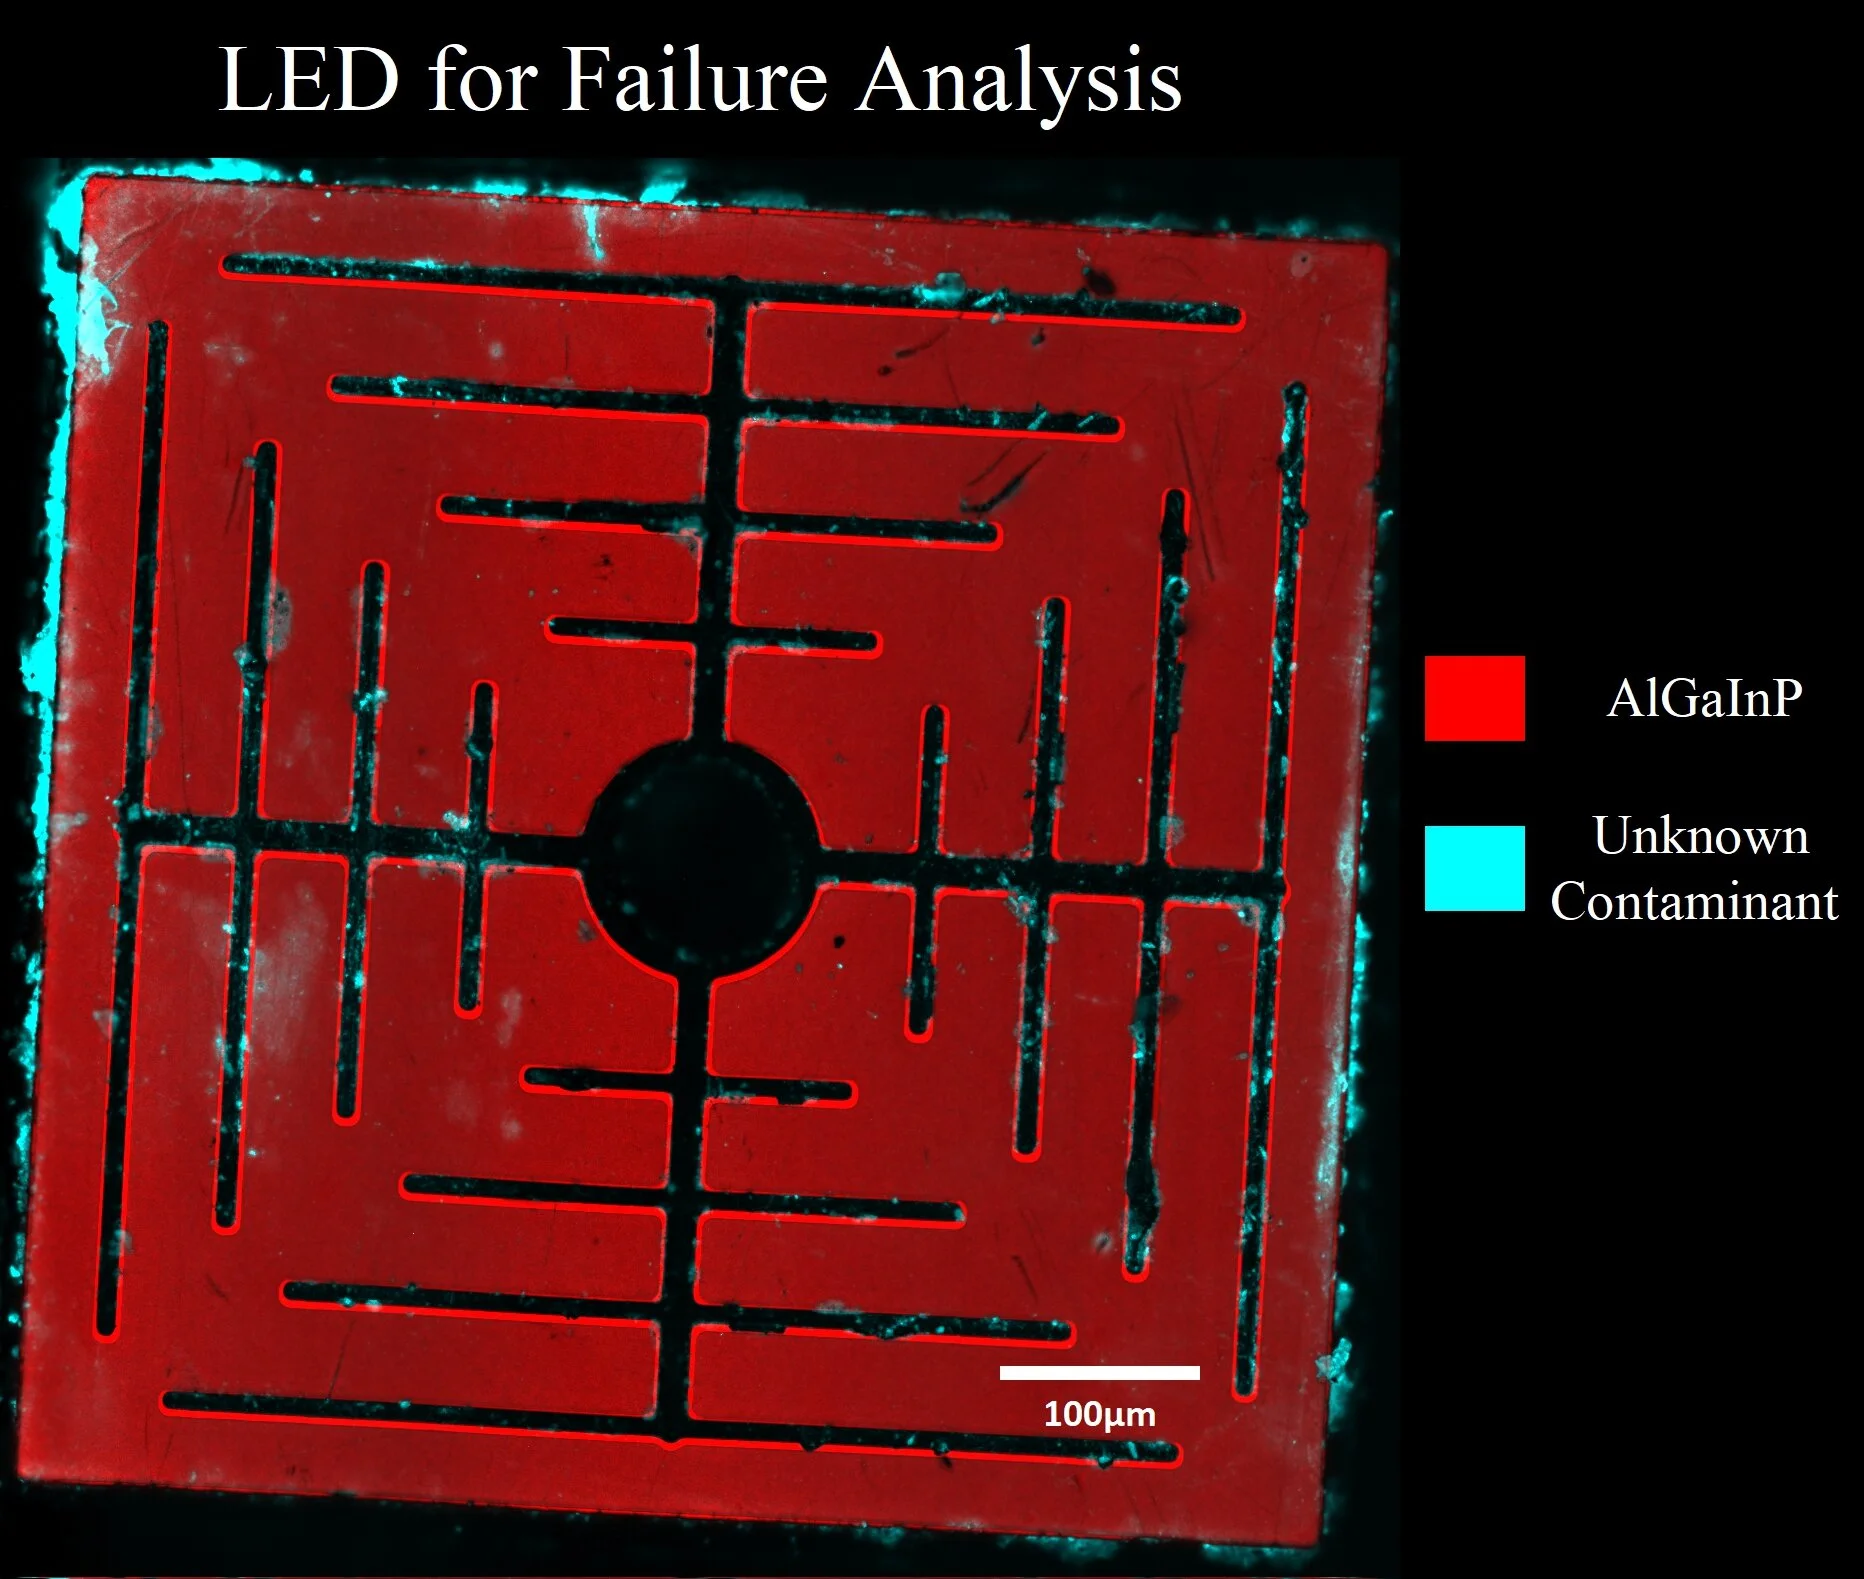
Test & Measurement Services
Klar offers measurement services to provide clients with photoluminescence (PL) and Raman maps of their samples. Klar will deliver maps, data sets, and peak fits for samples ranging from micron-to-centimeter sizes. Klar is presently offering deep UV, UV, visible, and near IR spectral maps (266 - 1700 nm).
Data Analysis
Klar Fit is a powerful, versatile spectral peak-fitting and data presentation package. This software was specifically designed to handle the large datasets collected by our microscopes, where a map could consist of over a million spectra each composed of thousands of values.
What Klar Microscope Users are Saying
-
No one else supplies anything like this.
-
We had to pick ourselves up off the floor when we learned it did simultaneous PL and Raman.
-
Easiest installation we ever had.
-
We rate equipment based on the number of swear words we have to use. Klar's score is zero.